Lena Burkhart had spent three weeks collecting quotes before she admitted to herself that she didn’t actually know what she was comparing. Her company, a mid-sized property management firm in Munich, wanted to build a tenant-facing application for rent payments, maintenance requests, and lease document access. The specification she had written was four pages long and specific about the features she needed. What it couldn’t control was how differently development partners interpreted it. A Berlin agency came back at €85,000. A partner in Warsaw quoted €34,000. A development house in Bangalore offered a fixed-price contract at €18,000. A freelance team in Kyiv assembled specifically for the project quoted €27,000. None of the partners explained the methodology behind their figures. None of them had asked her the same set of questions. Some were quoting iOS only. Some were quoting both platforms. One had included backend infrastructure and one had assumed she had an existing API. Lena’s experience is the standard experience of anyone sourcing a mobile application without a technical co-founder or an internal engineering team to translate between what she wanted and what each quote was actually covering. Engaging a Mobile App Development Company without understanding the cost framework that should govern the conversation is how organizations end up with four incomparable numbers and no basis for deciding between them. This guide provides that framework for 2026, covering the variables that drive cost, the regional benchmarks that make sense of rate differences, and the questions to ask before any quote is taken seriously.
The Variables That Actually Drive the Number
Every mobile application development quote is an estimate of hours multiplied by a rate. Understanding what drives each component of that calculation is what makes the resulting figure legible rather than arbitrary.
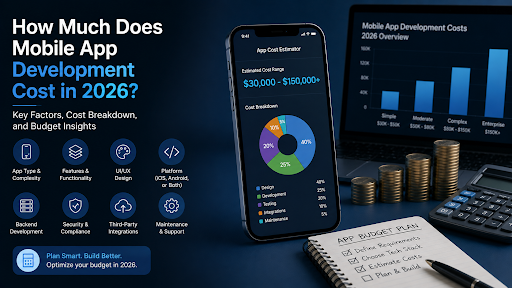
On the hours side, the primary drivers are application complexity, the number of platforms being built for, the depth of backend infrastructure required, the number and sophistication of third-party integrations, and the design investment that the product category demands. A simple application with five core screens, static content, and no backend can be scaffolded in days. A multi-sided platform with real-time data, payment processing, role-based permissions, third-party API integrations, and a design system built from scratch is a fundamentally different scope whose hours reflect that difference.
On the rate side, the primary drivers are team geography, team seniority, and whether the engagement is structured as a fixed-price project, a time-and-materials arrangement, or a dedicated team model. Each of those structures carries different risk profiles for the client: fixed price protects the budget but limits flexibility when requirements evolve, time and materials gives maximum flexibility but requires active scope management, and a dedicated team model works best when the product is ongoing rather than bounded by a defined delivery.
The most common source of quote incomparability, which was Lena’s problem, is that different providers are implicitly answering different questions. One is quoting the mobile application. Another is quoting the mobile application and the backend. A third is quoting both platforms. A fourth is quoting one platform with an assumption about the other. Requiring every provider to quote against the same explicit scope document, with backend and platform requirements stated rather than assumed, is the only mechanism that produces comparable figures.
What Different Complexity Tiers Look Like in Practice
Classifying applications into complexity tiers is a useful framework for initial budget orientation, with the understanding that the boundaries between tiers are fuzzy and that specific features can push a nominally simple application into a higher tier.
Simple applications cover basic informational content, user authentication, a small number of read-only data views, and minimal backend requirements. The tenant application Lena was scoping would not have qualified as simple despite its limited feature count, because real-time payment processing, document storage, and maintenance request workflows with photo attachment each carry backend complexity that inflates the hours estimate beyond what a simple screen count suggests.
Mid-complexity applications are the largest and most common tier: user accounts, dynamic content, multiple third-party integrations, a custom backend, real-time data requirements, and ten to twenty screens with non-trivial business logic. Most business applications, customer portals, marketplace MVPs, and operational tools fall into this tier. The range within this tier is wide, and the specific integrations and real-time requirements are the most significant within-tier cost drivers.
Complex applications include marketplace platforms with multiple user types, applications with significant algorithmic functionality, those requiring AI or machine learning infrastructure, multi-tenant enterprise systems, and any application that must integrate with multiple complex external systems simultaneously. Development timelines for this tier extend into the better part of a year for a first version, and the backend engineering effort frequently exceeds the mobile frontend effort as a proportion of total hours.
Lena’s application was mid-complexity. The €85,000 Berlin quote was reasonable for that tier from a Western European agency. The €18,000 Bangalore quote was almost certainly not covering the full scope, which the fixed-price structure made harder to verify without detailed scope decomposition.
Regional Cost Benchmarks in 2026
The rate differential between development teams in different geographies is real and significant, and it reflects a combination of labor market costs, purchasing power parity, and the density of experienced mobile development talent in each market. Understanding the benchmark rates by region is what allows a cost differential to be evaluated rather than simply noted.
North American development teams, primarily the United States and Canada, command the highest rates in the market. Senior iOS and Android developers in San Francisco, New York, and Toronto operate at rates that reflect one of the world’s most competitive technical labor markets. The premium is justified when deep domain expertise, regulatory knowledge, or timezone proximity to the client team is a genuine project requirement.
Western European teams in Germany, the Netherlands, Scandinavia, and the UK occupy the next tier, with rates that are meaningfully lower than North American equivalents while remaining significantly higher than Eastern European markets. Berlin and Amsterdam agencies serve as common middle-ground choices for European clients who want proximity and cultural alignment without North American rate levels.
Eastern European development markets, particularly Poland, Ukraine, Romania, and the Czech Republic, have produced some of the most technically capable mobile development talent in the world at rates that are typically 40% to 60% below Western European equivalents. The Warsaw quote Lena received at €34,000 was plausible for a competent Polish agency working on her specification.
South Asian markets, primarily India, offer the widest rate range of any geography. The range between a premium Indian agency with strong process discipline and a low-cost provider with limited senior oversight is wider in India than in any other market, which makes the headline rate less informative as a quality proxy. The Bangalore figure Lena received at €18,000 reflected either a genuinely scoped-down version of her product or a rate structure that would encounter scope expansion discussions once the project began.
The Total Cost of Ownership Question
Mobile app development cost as a single figure covering the initial build is the beginning of the financial picture rather than the complete picture. The ongoing costs that follow a successful launch, and that many initial cost discussions omit, determine whether the economics of a mobile investment work over a multi-year horizon.
Annual iOS and Android platform maintenance, driven by major OS releases that require application updates to maintain compatibility and App Store compliance, represents a recurring engineering expense that scales with application complexity. Infrastructure costs for the backend systems supporting the application scale with user volume in cloud environments, producing a cost line that increases as success grows. Product iteration based on user behavior, which is where most of the value of a mobile product is actually created, requires ongoing engineering capacity that should be budgeted from the start rather than treated as discretionary spending to be evaluated after launch.
The applications that produce the best return on their development investment are those whose owners treat the initial build as the cost of acquiring an asset that requires ongoing investment to appreciate, rather than as a project that concludes at launch and then self-maintains. Lena’s property management application, once built, will need to be updated for every major iOS and Android release, adapted as her business’s operational requirements evolve, and iterated based on what her tenants actually use versus what the specification assumed they would use. That ongoing investment is the cost of having a relevant product rather than a stale one.
Questions to Ask Before Accepting a Quote
The question that most effectively separates a credible quote from an incomplete one is: what is specifically excluded from this figure? Every provider will tell you what they have included. Asking explicitly for what is excluded forces the conversation about backend, about the second platform, about ongoing maintenance, about third-party service licensing, and about the project management overhead that is sometimes included and sometimes billed separately.
The second most useful question is: what happens to the budget when requirements change? All mobile projects encounter requirements evolution once real users interact with the product. The provider’s answer to that question reveals whether the engagement model is structured to handle that reality constructively or whether change requests will trigger adversarial conversations about whether a new requirement is inside or outside the original scope.
The third question, which Lena did not ask and should have, is: can I speak with two clients whose projects were similar in scope to mine? The portfolio a provider shows is curated. The clients they reference are the ones they are willing to have spoken with. The specific questions about timeline accuracy, budget adherence, and post-launch support quality will produce more useful information from a reference call than from any proposal document.
Lena ultimately chose the Warsaw agency at €34,000, negotiated a time-and-materials arrangement for the backend scope that was hardest to fix-price, and launched eleven months after the initial quote collection. The final cost came in at €41,000, 20% above the initial figure due to backend complexity that the original scope had underspecified. She considers the investment sound. Her tenant satisfaction scores for communication and responsiveness have increased measurably, and her property management team has reduced administrative overhead that the application absorbed. The gap between what she paid and what she got is the gap that understanding the cost framework before the quotes arrived would have reduced. Now she has both the product and the framework, which makes the next application she builds considerably easier to scope and considerably cheaper to get wrong.